


Accurately assessing patient longevity means combining validated physical fitness tests, clinical prognostic indices, and a thorough review of biological, psychosocial, and patient-centered factors. No single number tells the full story. The most reliable approach layers multiple evidence-based methods:
- Physical fitness tests: gait speed, single-leg balance, sit-to-rise, and grip strength
- Validated prognostic tools: ePrognosis, the LEAD model, and the Healthy Longevity Index (HLI)
- Clinical frameworks: the 4Ms (What Matters, Medication, Mentation, Mobility) and the CDC STEADI initiative
- Biomarkers and lab values: inflammatory markers, frailty indicators, and emerging digital biomarkers
- Patient-centered factors: goals, preferences, mental health, social support, and socioeconomic status
Each layer adds resolution. Together, they give clinicians and health-conscious individuals a far more accurate picture of long-term patient assessment than age alone ever could.
How validated physical fitness tests predict longevity
Functional fitness tests are among the most clinically accessible and predictive tools available. They require no lab equipment, take minutes to administer, and carry strong evidence linking performance to multi-year mortality outcomes.
Gait speed stands out as the single strongest physical predictor. Tools incorporating gait speed consistently outperform other geriatric assessment instruments in predicting mortality and adverse outcomes, with higher C-index values confirming its clinical relevance. A pace below 0.8 meters per second signals elevated risk; below 0.6 meters per second indicates high risk of functional decline and death within five years.
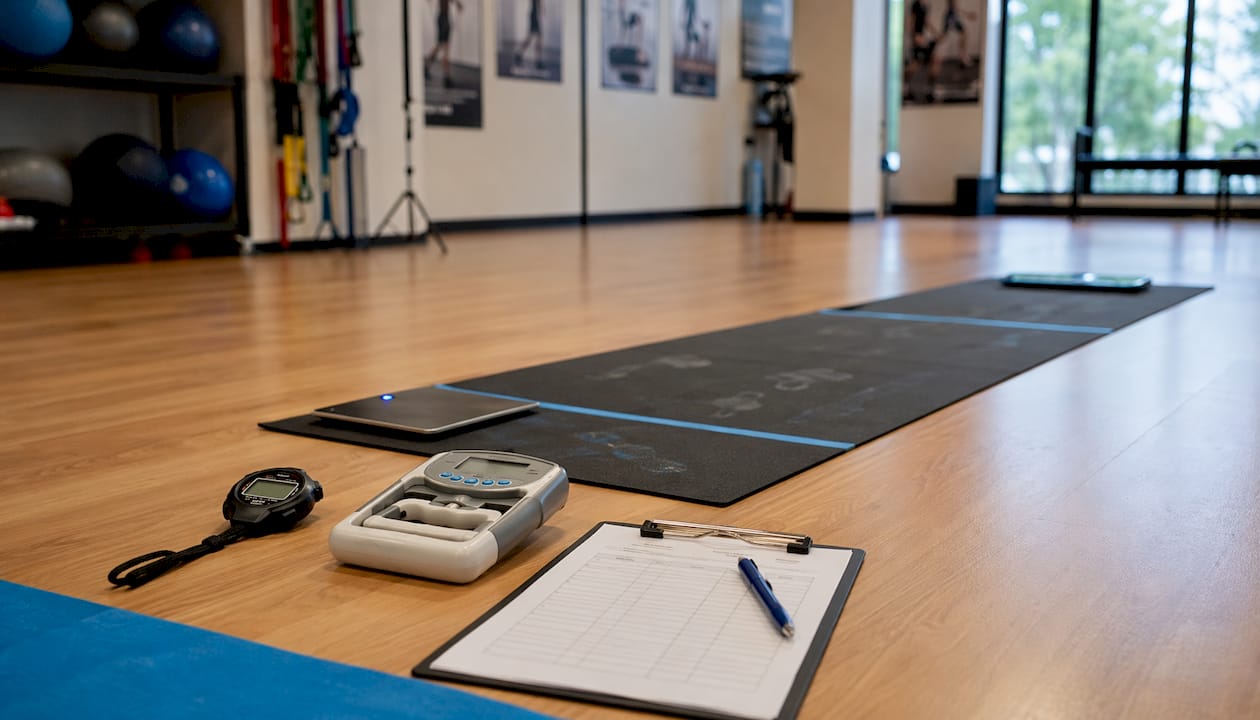
Single-leg balance tests fall risk directly. Patients who cannot hold a single-leg stance for at least 10 seconds face a substantially higher probability of falls, which remain a leading cause of mortality in older adults. The CDC STEADI initiative screens for fall risk with three targeted questions, integrating mobility and safety evaluation into routine longevity assessment.
The sit-to-rise test measures functional strength, flexibility, and coordination simultaneously. Patients score 0–10 based on how many body parts (hands, knees, forearms) they use to rise from and return to the floor. Scores below 8 correlate with higher all-cause mortality across age groups.
Grip strength serves as a proxy for overall musculoskeletal health and systemic resilience. Weak grip predicts cardiovascular events, hospitalization, and mortality independent of age and body mass index.
| Test | What it measures | Longevity signal |
|---|---|---|
| Gait speed | Walking pace over a set distance | Below 0.8 m/s linked to elevated mortality risk |
| Single-leg balance | Balance duration on one leg | Under 10 seconds associated with fall risk and mortality |
| Sit-to-rise | Floor-to-stand without support | Score below 8 correlates with higher all-cause mortality |
| Grip strength | Hand dynamometer reading | Low grip predicts cardiovascular events and hospitalization |
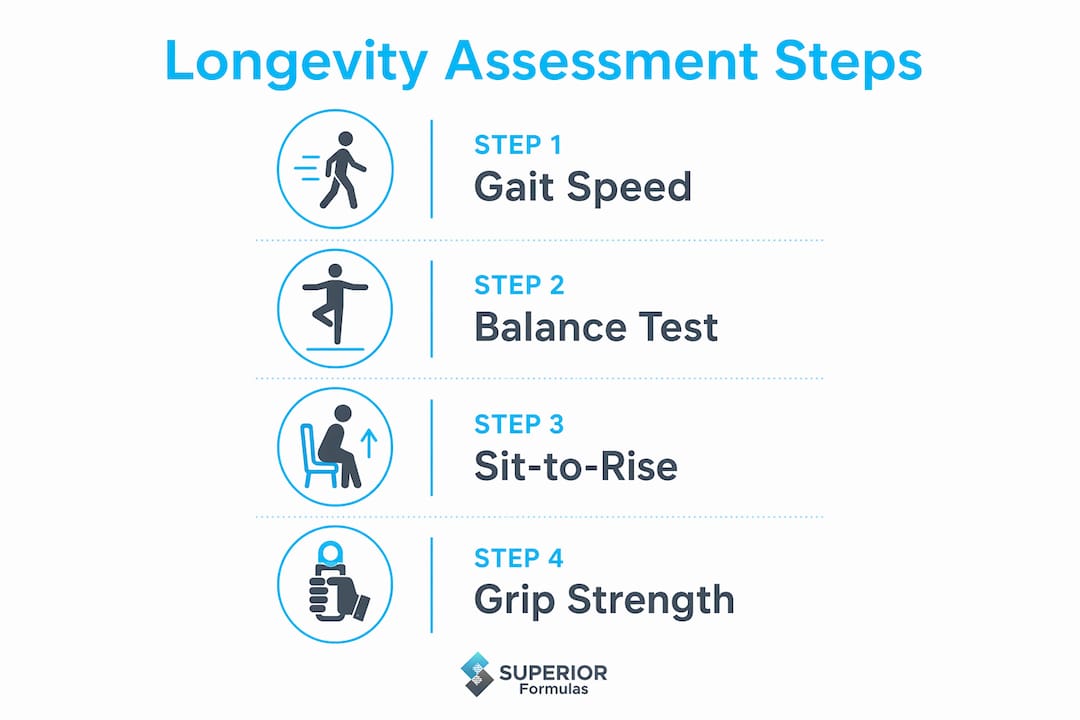
Pro Tip: Administer all four tests in sequence during a single visit. The combined picture is far more predictive than any one test alone, and the data feeds directly into prognostic index calculations.
Which clinical tools best estimate life expectancy?
Validated prognostic indices translate clinical data into life expectancy estimates that clinicians can use for shared decision-making, treatment planning, and care prioritization. Three tools stand out for their evidence base and practical utility.

ePrognosis
Developed at UCSF, ePrognosis is a free online compendium of validated prognostic indices for older adults across clinical settings: community, nursing home, and hospital. Selecting the right index depends on five factors: prediction accuracy, generalizability, usability, clinical efficacy, and the relevant time frame. The platform uses drop-down menus to calculate mortality risk from published formulas, removing the manual math burden. Clinicians should always verify that the index was developed in a population similar to their patient’s, since performance in the original study represents the ceiling for real-world accuracy.
LEAD model
The Life Expectancy Estimator for Older Adults with Diabetes (LEAD) predicts median life expectancy using 11 patient characteristics available in most electronic health records. It demonstrated a Harrell’s C-statistic of 0.78 in the primary test set, with consistent performance across subgroups defined by race, gender, and diabetes type. A risk score of 7 in the LEAD model corresponds to a median life expectancy around four years and an intermediate probability of surviving at least five years, as established in its primary validation cohort where a Harrell’s C-statistic of 0.78 was achieved. LEAD was designed for paper use or EHR integration, making it practical in high-volume clinical settings.
Healthy Longevity Index
The Healthy Longevity Index (HLI) integrates demographics, lifestyle factors, intrinsic capacity, and chronic conditions to predict 4-, 8-, and 12-year disability-free and dementia-free survival in primary care. It achieved a C-index of approximately 0.79, placing it in the “good discrimination” range. Unlike most mortality indices, the HLI targets healthy aging outcomes rather than death alone, making it especially useful for patients whose primary concern is quality of life over raw survival.
Key advantages and limitations at a glance:
- ePrognosis: broad index library, setting-specific, no single algorithm; requires clinician judgment to select the right index
- LEAD: diabetes-specific, EHR-ready, validated across diverse cohorts; limited to patients with diabetes
- HLI: disability- and dementia-free survival focus, integrates lifestyle and digital biomarkers; newer tool with less independent validation to date
Combining results from two or more indices, then reconciling them with clinical judgment, produces more reliable estimates than relying on any single tool.
Clinical factors and frameworks that shape longevity predictions
Foundational biological factors
Age, sex, and family history set the baseline for any patient longevity evaluation. But they are starting points, not conclusions. Age alone is a misleading proxy for life expectancy and can result in substantial misclassification when used without additional clinical data. Comorbidity burden compounds this: patients with multimorbidity (two or more chronic conditions) face compounding mortality risks that no single-disease model captures accurately.
Psychosocial modifiers
Mental health, social isolation, and socioeconomic status significantly influence longevity outcomes beyond what biological measures capture. Depression accelerates functional decline; social isolation carries mortality risk comparable to smoking 15 cigarettes per day in some population studies. Clinicians who skip psychosocial screening miss a meaningful portion of the mortality signal. Maintaining thorough longitudinal records of these factors, including long-term medical records, supports more accurate trend analysis over time.
The 4Ms framework
The 4Ms framework, endorsed by the CDC and the Institute for Healthcare Improvement, organizes geriatric assessment around four domains:
- What Matters: patient goals, values, and care preferences
- Medication: review for polypharmacy, high-risk drugs, and deprescribing opportunities
- Mentation: cognitive screening and depression assessment
- Mobility: fall risk, gait evaluation, and physical function
This framework prevents the common error of optimizing one domain while inadvertently harming another. A patient whose mobility improves after aggressive physical therapy but whose medication burden goes unreviewed may still face elevated mortality risk.
STEADI and fall risk
The CDC STEADI initiative screens for fall risk using three specific questions covering fall history, unsteadiness, and fear of falling. Falls are a leading cause of injury-related death in older adults, and early identification through STEADI allows targeted intervention before a fall occurs.
Ethical considerations
Prognostic indices often fail to capture protective social factors, and their predictions are bounded by the original cohort’s characteristics. Overreliance on an index without clinical context can misclassify patients and lead to undertreating those with better-than-predicted prognosis or overtreating those near end of life. Patient preferences must anchor every clinical decision that flows from a longevity estimate. Sharing a predicted life expectancy requires sensitivity, clear framing of uncertainty, and a genuine conversation about what the patient values most.
What recent research reveals about longevity assessment
Longevity assessment is moving from reactive disease management toward proactive risk prediction, with advanced imaging and biomarker detection identifying subclinical disease years before symptoms appear. Whole-body MRI and CT angiography are entering clinical longevity practice as tools for early cardiovascular and oncologic risk detection, though their operator-dependent nature means results hinge on technician skill and institutional expertise.
Wearable devices and real-time digital biomarkers are adding a continuous data layer that static clinic visits cannot replicate. Gait variability measured over weeks, heart rate variability trends, and sleep architecture data each contribute signals that complement point-in-time physical tests. The HLI was specifically designed to incorporate these digital inputs as they become available in primary care workflows.
Statistic callout: The LEAD model achieved a Harrell’s C-statistic of 0.78 in its primary validation cohort, with performance above 0.74 across all temporal validation sets, confirming consistent discrimination across diverse patient populations and time periods.
A systematic review of 16 validated prognostic indices found that while 13 achieved C-statistics at or above 0.70, none exceeded 0.90, and only two were independently validated by investigators unaffiliated with the original development team. That gap between development performance and real-world application is exactly why clinical judgment remains irreplaceable. Indices inform; they do not decide. The best practitioners treat a prognostic score as one input in a broader clinical conversation, not as a verdict. Pairing index results with the latest healthy aging evidence gives both clinicians and patients a more complete framework for long-term planning.
Key Takeaways
Accurate patient longevity evaluation requires layering validated physical tests, evidence-based prognostic indices, clinical frameworks, and psychosocial data rather than relying on any single measure.
| Point | Details |
|---|---|
| Physical tests are foundational | Gait speed, grip strength, sit-to-rise, and single-leg balance each independently predict multi-year mortality. |
| LEAD offers EHR-ready precision | Using 11 standard inputs, LEAD achieves a Harrell’s C-statistic of 0.78 for older adults with diabetes, demonstrating strong discrimination in predicting mortality. |
| HLI targets quality of life | The Healthy Longevity Index predicts disability- and dementia-free survival with a C-index of ~0.79. |
| 4Ms and STEADI structure assessment | These frameworks cover medication, cognition, mobility, and fall risk within a single clinical visit. |
| Psychosocial factors modify outcomes | Mental health, social support, and socioeconomic status shift mortality risk beyond what biological markers capture. |


